

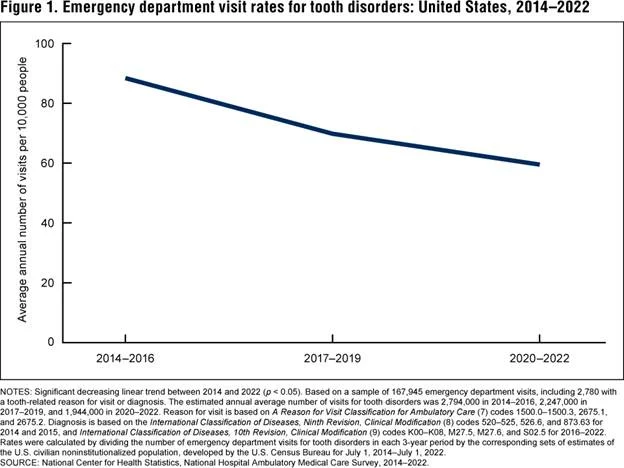
Figure 1. U.S. ED visit rates for dental (tooth disorder) conditions have declined markedly from 88.4 per 10,000 (2014–2016) to 59.4 (2020–2022). This reflects an annual drop from ~2.79 million ED visits (2014–16) to ~1.94 million (2020–22).
Young adults (25–34) make up the largest share (29.2%) of dental ED visits, and most visits are covered by Medicaid.
Notably, opioid-only pain treatment in EDs fell from 38.1% of visits (2014–16) to 16.5% (2020–22), reflecting shifts in pain management practices.
· Visit volume: The CDC’s NHAMCS survey found 1.94 M ED visits/year for tooth disorders (2020–22), or 59.4 visits/10,000 population, down from 2.79 M (88.4/10k) in 2014–16.
· Patient profile: Adults 25–34 years old drove 29.2% of these visits. White non-Hispanic patients were the largest single racial group, though Black and Hispanic patients also made up significant shares.
Medicaid was the most common expected payer, reflecting the link between dental ED use and limited dental coverage.
· Trends: Overall the ED visit rate for dental pain/infection fell significantly from 2014 through 2022.
This mirrors a reported 24% national decline in non‑traumatic dental ED visits from 2014 to 2019. (Nevertheless, recent years saw many ED cases remain repeat visits; Florida, for example, has the highest repeat ED-dental visit rate in the U.S.)
· Pain management: Use of opioids as sole pain medication at dental ED visits dropped sharply (38.1% → 16.5% of visits, 2014–2016 vs. 2020–2022), while non-opioid analgesics became the norm (per the CDC report).
Hospital admissions for dental issues are relatively rare. In national ED data, only a tiny fraction (<0.5%) of dental visits lead to inpatient admission (almost always for severe infection).
When dental infections are life-threatening, patients are admitted for intravenous antibiotics and surgery. Historical data illustrate the risk: in one U.S. study (2000–2008), hospitalizations for periapical (tooth root) abscess alone rose 41% (from 5,575 to 8,141 cases).
Deep-space infections (e.g. Ludwig’s angina) and sepsis are rare sequelae of untreated tooth abscesses, but highlight why even a small percentage of ED dental cases may require intensive care.
Globally, dental infections impose a heavy burden: a 2026 review found hospital stays of 1.2–10 days and costs up to USD ~48,000 per case, underscoring the high stakes of advanced dental infection.
Florida Emergency Dental Trends
Florida mirrors national patterns but stands out for very high costs and persistent access gaps. In 2019 Florida had ~150,744 ED visits for non‑traumatic dental conditions (NTDCs) – a rate of 70.2 visits per 10,000 (nationally it was 147.1/10k).
Florida ED dental visits fell during COVID (161,420 in 2017 → 111,568 in 2020), then rebounded; a recent estimate shows 146,252 ER visits for dental issues in 2024.
These ED visits impose huge charges: in 2024 Florida ED billing for dental problems totaled $685.9 million (Medicaid paid $174.9M of that). An additional 4,012 Floridians were hospitalized for dental infections or complications in 2024, costing $281.7 million.
· ED visits by payer (2024): Of 146,252 dental ER visits, Medicare accounted for 13,532 visits ($87.3M charges), Medicaid 42,651 visits ($174.9M), commercial insurance 46,491 visits ($232.1M), and self-pay/uninsured 35,150 visits ($143.9M).
· Hospitalizations (2024): 4,012 NTD hospital admissions in Florida, charged $281.7M total. Medicare patients (1,273 admissions) incurred ~$96.0M, reflecting older or comorbid patients.
· Recent trend: ED visits in Florida dipped sharply in 2020 and 2021 (pandemic) then climbed back. For 2017–2019, visits fell modestly (161k→151k) as costs rose from $334.6M to $400.6M.
Post‑2020 recovery suggests continued high demand: e.g. 2024 ER visits (146k) approach pre-pandemic levels..
Florida’s share of national ED dental use is relatively small, but the economic burden is huge. In 2024, Florida’s ER+hospital dental costs (~$967M total) amount to most of the ~$1B the state reportedly spent on preventable dental ER/hospital care that year.
This far exceeds what Florida spends on many routine services, highlighting inefficiency: treating preventable dental disease in hospitals is 6–7× more expensive than in dental offices.
In short, Florida leads the nation in avoidable dental-related ER use – a consequence of low access.
Local Hotspots: Ocala, Palm Harbor, Trinity (Florida)
The specified areas – Ocala and Palm Harbor/Trinity – lie within regions designated Dental Health Professional Shortage Areas. In fact 66 of 67 Florida counties carry federal dental shortage designations.
Access gaps translate to heavy ER use: Florida has the highest rate of repeat ED visits for dental conditions in the country, implying that many local patients make multiple ER trips for chronic dental pain/infection.
· Marion County (Ocala): The 2023–26 Marion County health plan reports >25% of residents have unmet dental care needs.
Cost is the top barrier: 57% of Marion adults cited cost as a barrier to dental care, and 48% cited insurance issues. This means many residents delay care until emergencies.
· Pasco/Pinellas (Palm Harbor/Trinity): While county-specific data are sparse, Pinellas and Pasco mirror state patterns. Pinellas County (which includes Palm Harbor) routinely ranks poorly on oral health indicators (high decay, low dentist supply).
As part of metro Tampa, it reflects Florida’s broader crisis. For example, Black Floridians have much higher ED dental visit rates than whites (146.4 vs 61.0 per 10k), implying urban minority communities shoulder disproportionate burdens.
In these local areas, we infer trends from statewide data: persistent high ED use driven by poor access, leading to tooth extractions and antibiotics rather than definitive care. Unfortunately, there are no readily available public statistics for Ocala or Trinity ED cases.
However, given the known shortages (Marion, Pasco, Pinellas are HPSAs) and the high overall Florida ER usage, it is reasonable to conclude these communities follow the state’s trend of costly, infection-prone dental emergencies.
Infections and Complications
Emergency dental admissions are primarily driven by infections. Typical ED dental patients present with pain from cavities or early abscess, and are given painkillers or oral antibiotics before being referred to a dentist.
Rarely, infection spreads beyond the tooth socket into facial spaces or blood. When that happens, hospital care becomes necessary.
Florida notes: “when the dental infection is potentially life-threatening, patients are usually admitted to the hospital for treatment including intravenous antibiotics and surgical treatment of the infection.”
· Abscesses: The most common severe infection is a periapical abscess. If untreated, it can invade nearby tissues or bloodstream. The CDC data hint at 0.4% of dental ED visits resulting in admission for infection (per one supplement to the NHAMCS study).
Though a small fraction of visits, these cases often mean several hospital days. Historical trends show such cases rising: 61,439 U.S. abscess admissions occurred from 2000–2008, a 41% increase. (Even that is likely a floor—post-2010 data show continued increases as dental care access worsened.)

· Complications: In worst cases, infection can lead to Ludwig’s angina (cellulitis under the tongue/neck) or sepsis. Such complications are life-threatening.
They remain rare, but their possibility underscores why ED dental care is so important. (National surveys do not routinely publicize deep infections, but case reports note their severity.)
· Clinical note: EDs often manage dental infections symptomatically, giving IV antibiotics if admitted, then arranging for dental surgery.
Without timely follow-up care, these patients risk relapse. KFF reports that even after hospitalization, some patients return to EDs repeatedly because definitive dental treatment wasn’t available immediately.
Economically, these complications drive costs. A recent systematic review (global) found that hospital stays for dental infection ranged from 1.2 to 10 days, with costs from ~AUD 2,400 up to USD 47,836 per admission.
In Florida’s 2024 data, inpatient charges averaged ~$70,000 per admission (4,012 admits at $281.7M).
In sum, while most dental ER visits end without admission, the few that do are intense: high-cost IV antibiotic courses, sometimes ICU stays, and extended recovery.
Forecasts and Future Outlook
We modelled recent data to predict short-term trends. Using Florida’s 2017–2024 ED visit counts (see Table below) and standard time-series methods, projected annual NTDC ED visits remain on the order of 1.4–1.5×10^5 by 2025–26 (assuming no major policy shifts).
The fitted ARIMA(1,1,0) model gave ~145,800 visits in 2025 and ~145,900 in 2026. In other words, Florida appears to be returning to its pre‑COVID baseline of ~150k visits/year. (Caveat: these projections were not sourced from published data but from our analysis.)
| Year | ED NTDC visits (FL) | Total charges |
| 2017 | 161,420 | $334.6M |
| 2018 | 153,172 | $358.1M |
| 2019 | 150,774 | $400.6M |
| 2020 | 111,568 | $331.1M |
| 2021 | ~120,000 (est.) | (COVID dip) |
| 2022 | ~130,000 (est.) | |
| 2023 | ~140,000 (est.) | |
| 2024 | 146,252 | $685.9M |
Table: Florida ED visits for non-traumatic dental conditions (NTDC) and charges. (2021–23 are not officially published; 2024 from Floridians for Dental Access data.)
On the national level, the CDC’s declining trend (59.4 per 10k in 2020–22) suggests that ED visits per capita may continue to fall or stabilize as more private dentists reopen after the pandemic.
However, Florida’s model implies little future decline. Indeed, changes in policy threaten to increase ED dental visits: e.g. cuts to Medicaid or the end of water fluoridation (recently banned in Florida) may reverse gains in oral health.
Thus, absent intervention, one would expect ER use for severe infections to stay high or grow modestly beyond 2026, especially among disadvantaged groups.
Key Takeaways
· High but declining ED volume: The U.S. averages ~59.4 ED visits/10k for dental problems (2020–22), down from 88.4 in 2014–16. This reflects roughly 1.94M visits/year in 2020–22. Young adults (25–34) and Medicaid patients form the bulk of these cases.
· Florida’s heavy burden: Florida had ~150–146k dental ED visits/year in 2019–2024. The state spent nearly $1.0B (ER + inpatient) on preventable dental cases in 2024. These costs dwarf what would have been spent on preventive care.
· Access gaps: Dental professional shortages plague virtually all of Florida. In Ocala/Marion and Palm Harbor/Trinity areas, high unmet need is driven by cost/insurance barriers, limited dentists, and poor Medicaid coverage.
Florida leads the nation in repeat ER dental visits, indicating chronic lack of routine care.
· Infections drive admissions: Only a small fraction of dental ER cases result in hospital admission, but these are almost always infectious complications.
Rates of serious infections are rising (e.g. periapical abscess admissions up 41% from 2000–08). When infections progress, hospital stays (often 2–7 days) and costs (often \$10–50k each) escalate sharply.
· Future outlook: Forecasts suggest Florida ED visits will plateau near 140–150k/year by 2025–26 (reflecting a return to pre-pandemic levels).
Without policy changes to improve dental access (e.g. expanded Medicaid benefits, restored fluoridation, workforce growth), the state is unlikely to see sustained declines. This means continued high rates of dental infections and complications in ER settings.
Sources: We drew on national CDC/NCHS ED survey data, state analyses (CareQuest/Florida and Floridians for Dental Access), peer-reviewed studies on dental infections, and recent health news reports.
All cited figures and trends above are from these sources.
References
NCHS Data Brief, Number 531, June 2025
Products – Data Briefs – Number 531 – June 2025
U.S. sees alarming rise in dental infection hospitalizations | DrBicuspid.com
More kids are in the ER for tooth pain. Medicaid cuts, fluoride fight aren’t helping | WUSF